Interactive Map
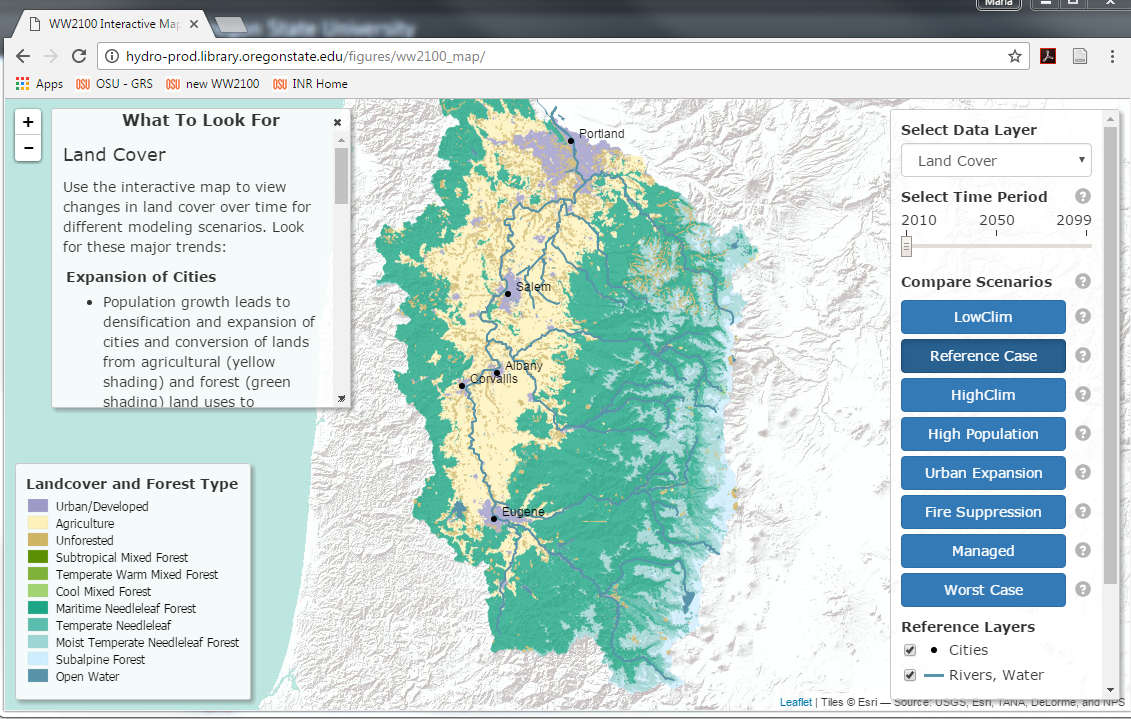
You can view spatial output from Willamette Envision simulations via an interactive map developed by OSU graduate student Dan Stephens. The map displays output from different model simulations.The simulations project how the landscape might change in response to changes in climate conditions, population growth, and land and water management policies. Please use Google Chrome or Firefox web browsers to view the map.
The map displays four types of output from modeling simulations -
- land cover - including simulated changes in developed land area in the Willamette valley and changes in forest types in the Coast Range and Cascade mountains
- snow water equivalent - a measure of simulated snowpack, averaged by decade
- land values - simulated for developed and agricultural lands in the Willamette valley
- evapotranspiration - the amount of water vapor released from soils and plants into the atmosphere, averaged by decade for different simulations
The map displays a subset of WW2100 scenarios. The table below highlights key differences between the scenarios featured on the map. For more details about modeling scenarios and their assumptions, refer to the scenarios web page.
| Scenario | Climate Change | Population Growth | Selected Management Assumptions |
| Reference Case | middle range climate change; ~4°C (~7.5°F) increase in Willamette River Basin (WRB) annual mean temperatures over century | pop. in 2010 = 2.41M; 2100 = 5.37M |
- forest wildfire suppression at historical rates; forest area burned increases from 0.2%/yr in 2010 to 0.6%/yr in 2100 |
| LowClim (Low Climate Change) | ~1°C (2°F) increase in WRB annual mean temps. over century | same as Reference Case | same as Reference Case |
| HighClim (High Climate Change) | 6°C (~10.5°F) increase in WRB annual mean temps. over century | same as Reference Case | same as Reference Case |
| High Population | same as Reference Case |
pop. growth rates within UGBs doubled relative to Ref; pop. in 2100 = 8.25M |
same as Reference Case |
| Urban Expansion | same as Reference Case | same as Reference Case |
- urban growth boundaries expand when 70% developed; no urban reserves |
| Fire Suppression | same as Reference Case | same as Reference Case |
- wildfire suppression efforts increase to hold area burned per year to historical rates |
| Managed | same as Reference Case |
- differential increase in wildfire suppression on private and public lands; resulting increase in forest area burned on private lands from 0.2%/yr in 2010 to 0.3%/yr in 2100 and on public lands from 0.2%/yr in 2010 to 0.8%/yr in 2100 |
|
| Worst Case | same as Reference Case | same as High Population |
- wildfire suppression same as Fire Suppression scenario |
