Agricultural Land & Water Use
The Willamette Valley is home to a large agriculture sector that sustains an important part of the Oregon economy. The water used in producing both irrigated and nonirrigated crops in the valley’s diverse agricultural system depends on several factors, including crop and soil type, precipitation and temperature, water rights, costs, and other factors. To understand and anticipate long-term water-use trends within the region’s agriculture industry, economic models were developed to describe the location, timing, crop choices, and irrigation decisions involved in agriculture in the Willamette River Basin (WRB). These economic models characterize land-use decisions based on economic returns to different land uses, crop choices that reflect economic returns to different crops, irrigation decisions that reflect the economics behind utilizing existing water rights, and the economics behind acquiring additional water rights, based on a range of factors that vary by location and year. These models generate estimates of daily water quantities expected to be used at each location in each subbasin in the WRB in future decades, for both surface water and groundwater. These projections show a small decline of 8% in both farmland acres overall, and also for surface and groundwater irrigated acres (a 5% reduction). These trends are mainly due to the expansion of urban land development that displace agriculture. Climate change and the resulting warmer summer temperatures are not found to have a significant effect on crop water requirements. Indeed, warmer temperatures are found to lead to earlier planting dates, which in turn give rise to earlier start and finish dates for irrigation. This means that a larger proportion of crop water demand takes place earlier in the season, when average temperatures are lower and precipitation is higher.
Agricultural Land and Water Use Methods in Brief
Agricultural water use depends on a range of factors. These include (1) the land area on which agriculture is practiced, (2) the choice of crops, (3) whether irrigation water rights are held, the availability of water from a given source, and the usage rates of those irrigation water rights. Water is consumed by plants on a daily basis, whether irrigated or not. For rain-fed agriculture crops, water demand will reduce the amount of water in soils, in groundwater reserves, and the amounts seeping to streams; for surface irrigation, the crop water demand will involve diverting water from surface flows when soil moisture is insufficient to meet crop water needs.
Agricultural Modeling
The agricultural water use models consist of several interconnected economic models including the limitations imposed by water rights and dynamic models of agricultural evapotranspiration and evolving soil moisture. The models operate at the scale of the Willamette Envision’s map polygons, which are called Integrated Decision Units (IDUs). The four economic models determine: (1) which lands are put to agricultural uses, (2) which crops are grown on a given parcel of land, (3) whether the parcel of land has or will have an irrigation water right, and (4) whether the irrigation water right is used in a given year. These four models interact with the agricultural evapotranspiration model (crop water demand) that simulates daily evapotranspiration (ET) as a dynamic function of climate, land cover, soil water, and growth stage of each crop, from planting date, to ‘greening up,’ to harvest and dormancy. Soil water will vary as a function of precipitation, crop cover, irrigation, and seepage. These four models also interact with water rights that may impose limits on the timing and quantities of water available for irrigation. Farmland transitioned in or out of agriculture versus developed or forest land uses is described in the land use change section. This page provides a brief overview of agricultural modeling in Willamette Envision. For a more complete explanation, refer to refer to Kalinin (2013) and Jaeger et al. (in prep).
In a given year where a particular land parcel is assigned to the agricultural land use, farmer decisions are modeled to simulate crop and irrigation decisions. Irrigation is only possible on IDUs with existing irrigation water rights. These initial decisions are then followed by daily decisions related to planting and harvesting, and (possibly) applying irrigation water. The availability of irrigation water is also subject to regulatory shutoffs in accordance with the prior appropriations seniority system under state law (discussed below).
The combination of decisions, choices, actions, and responses to other factors produces a unique pattern of crop water use, irrigation diversions, soil moisture, and groundwater contributions. It also influences economic returns to farming (annual farmland rent) at the parcel level. To the extent that irrigation water is shut off by regulators, current and expected future annual farmland rent is reduced.
The crop choice model estimates the probability of growing each of seven crop types or groups for the modeled year. The empirical model is estimated at the parcel level based on observed cropping patterns in recent years. The model estimates the crop observed as a function of IDU characteristics including soil quality (land capability class), elevation, and the presence of an irrigation water right, as well as varying attributes, crop prices and expected water availability (for those IDUs with irrigation water rights). Given the estimated probabilities for each IDU, the simulation models determine the crop for each IDU in each year with a random draw reflecting these estimated probabilities. No evidence of crop choices being correlated across years (i.e., a crop rotation schedule) were found in the data or in interviews with farmers or agricultural extension personnel. The resulting modeled values are interpreted as the probabilities for each crop to be grown. For perennial crops (orchards, vineyards, tree crops), a fixed set of IDUs is permanently assigned.
The model of irrigation decisions is based on a detailed farmer survey conducted for WW2100 by the USDA National Agricultural Statistics Service (Kalinin, 2013). Data on a six-year history of irrigation and cropping practices for a sample of fields from 530 randomly selected farmers was collected. From this, an irrigation decision model was estimated to represent the probability of irrigating a specific parcel as a function of parcel attributes (e.g., soil type, elevation), and seasonal factors (e.g., June precipitation).
The economic rent or annual profit from farming a given piece of land can play an important role in farm decisions to plant a crop, irrigate, or transition out of farming. Our estimate of farmland rent takes a “Ricardian” approach that is common in models of the economic returns to agriculture (Mendelsohn et al., 1994). Land value is assumed to equal the net present value of future rents from putting the land to its highest value use; as a result, we expect to see variation in land values and annual rents due to characteristics of the land that would influence agricultural productivity such as soil quality and precipitation or irrigation water rights. Similar to the hedonic model of crop choice, here we decompose the farmland rents associated with factors affecting agricultural productivity (see Kalinin, 2013 for more detail).
Agricultural lands in the WRB that currently do not have irrigation water rights may benefit from opportunities to acquire new water rights under federal contracts for stored water at one of the US Army Corps of Engineers reservoirs. The profitability of a new contract for stored water will depend on a comparison of the irrigation benefits (higher yields and wider range of crop choices) and the additional costs (capital investments in infrastructure, labor, and energy costs). For farmlands with existing irrigation water rights, these costs and benefits are already incorporated into the WW2100 estimates of farmland rent (annual profits) by soil class.
For new contract water rights, we would expect the irrigation premium to be the same as for existing irrigation water rights if the costs of irrigating are similar to the average costs for existing surface and groundwater rights. In the case of new water rights from stored water, we expect the costs to be somewhat higher due to a) the fee paid to the Bureau of Reclamation for the water contract, b) the extra cost for mainline conveyance to bring the water from a below-reservoir tributary to the field, and c) the extra lift required. Whether a new irrigation water right is attractive to a farmer depends on its profitability. Farmlands without irrigation water rights are given the opportunity to acquire new irrigation water rights based on stored water in the “New Irrigation Scenario,” provided that there is an economic justification for doing so.
Water Rights Modeling
Irrigation water demands compete with other water uses, include instream water rights. Because irrigation and instream water rights have the greatest potential to compete directly, we include a description of these water rights and our modeling of them here.
Water is allocated in the WRB according to Oregon water law, which operates according to the “prior appropriations doctrine” used in Oregon and most western states (Getches et al., 2015). The water rights system allocates water according to water right priority date (first date of use historically). Under Oregon law, all water is publicly owned. Water rights certified by the state are defined in terms of the timing of use, the maximum rate of diversion, and the annual volume allowed under the water right. When conflicts arise due to shortage, the more senior water right is given priority, while more junior water rights are required to curtail their water use if it conflicts with the senior water right holder. Water rights may be transferred between points of use under Oregon law when transactions are arranged by parties and approved by the OWRD (Amos, 2008), for example an irrigation right transferred from one farm to another.
Willamette Envision mimics this process: it takes account of the demand or request for water at a given point of diversion (POD) on a given day (from a farm, city, rural residential water user, or instream flow water right), and it evaluates the availability of water from the relevant streams and groundwater source. If there is sufficient water available, it withdraws water to satisfy the demand. If there is insufficient water to meet the needs of an existing water right, the request is denied. At the same time the model determines whether there is a junior water right in the same river reach or any upstream reaches that could be curtailed to make additional water available to satisfy the senior water right. A similar procedure is followed to satisfy instream water rights by protecting flows in streams where such water rights exist. The model includes instream water rights implemented as of 2010. When more than one instream water right applies at the same time to the same reach, the water rights model applies both water requirements. If an instream water right is “senior” to an irrigation water right, the irrigator may be shut off is there is insufficient water to meet both demands. Willamette Envision includes more than 15,000 irrigation water rights, 1,000 municipal water rights, and 90 instream water rights.
Select Findings from Agricultural Analysis
Agricultural Water Use
-
The agricultural land use model estimates that total farmland will decline gradually in coming decades, by about 8% by the year 2100. Irrigated lands are projected to decline by 5% (Fig. 1).

Figure 1. Projected agricultural lands in the WRB for the Reference Case scenario.
-
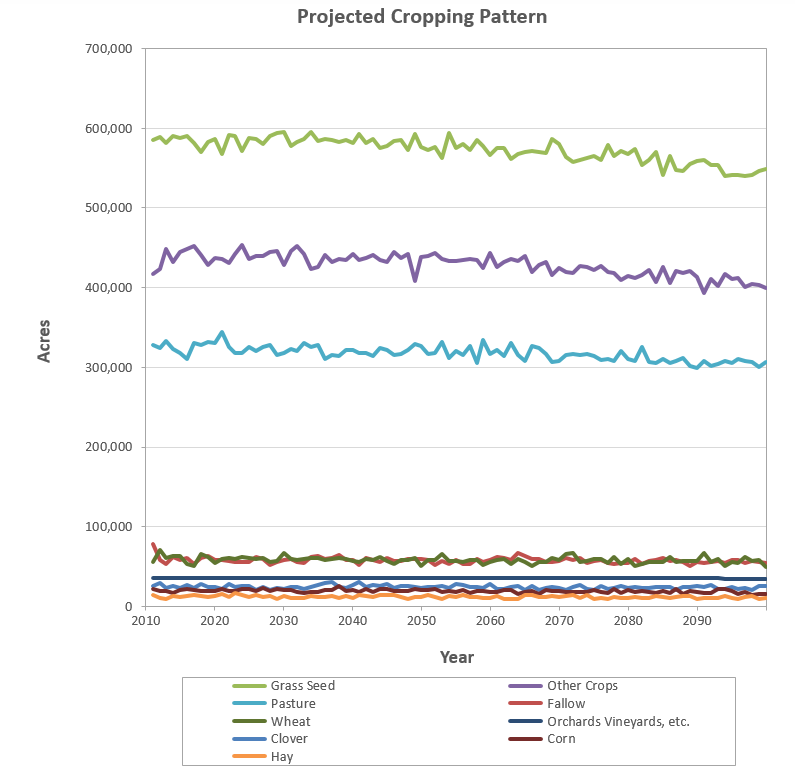
Cropping patterns are expected to remain stable in coming decades for the largest crops (by acreage). Given the very large number of crops grown in the WRB, the data suggest that possible increases or decreases in the acres planted for one or several crops is unlikely to have a significant effect on total crop water use (Fig. 2).

Figure 2. Projected cropping patterns in the WRB for the Reference Case scenario.
-
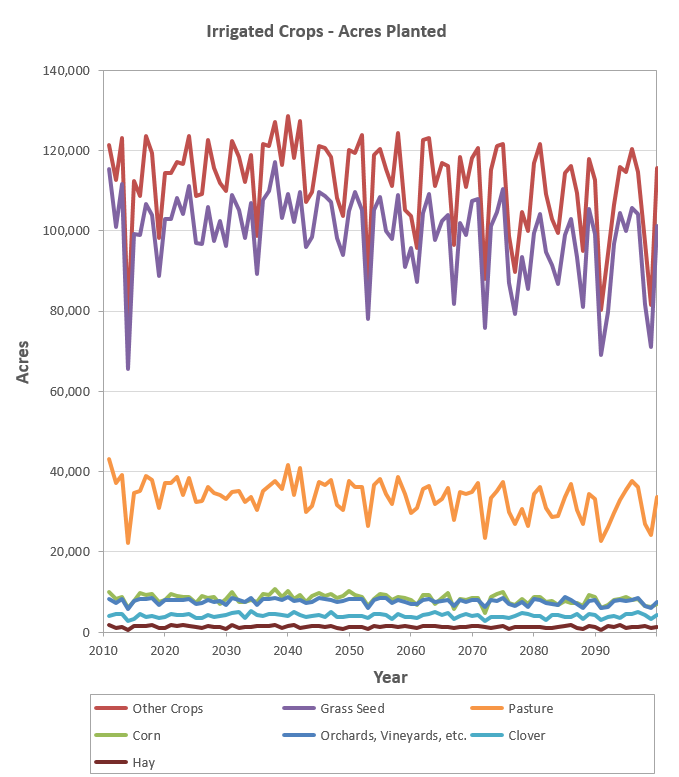
The acreage irrigated in the WRB in any given year represents about 17% of the total agricultural land area of 1.5 million acres, with about half of this being surface water irrigated. There is significant year-to-year variation in the crops and acreage irrigated (Fig. 3). Diverted Irrigation amounts vary significantly year to year, but are estimated to average 435,000 ac-ft initially while declining by about 15% late in the century in the Reference Case scenario.

Figure 3. Irrigated crops, by acres planted, for the Reference Case scenario.
-
Agricultural land values vary due to differences in soil type, elevation, average temperature, and precipitation, as well as with ownership of an irrigation water right (Fig. 4).

Figure 4. Agricultural land values.
-
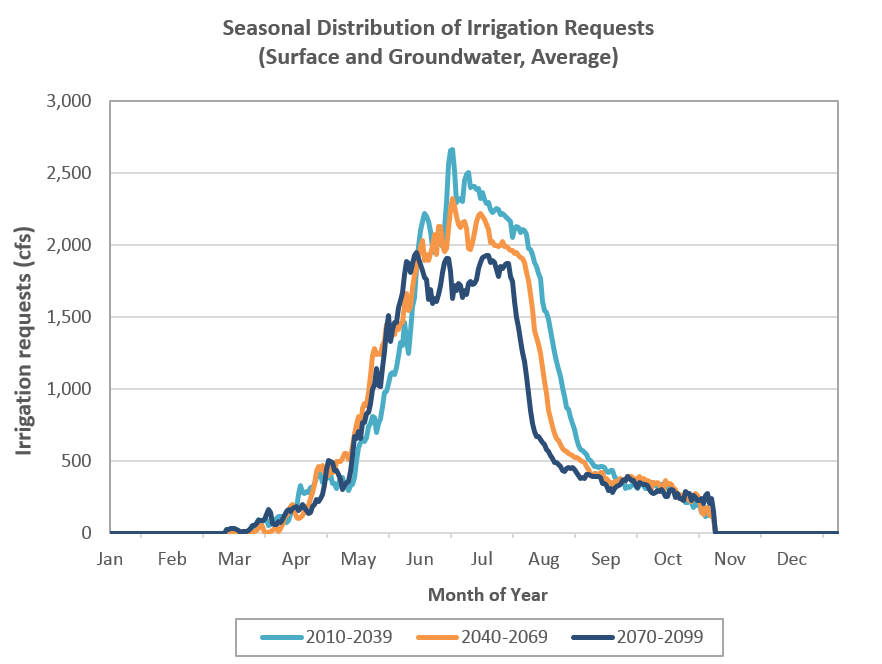
In any given year there are a number of irrigation water rights that are shut off by regulators during the growing season due to a lack of available surface water. Consistent with Oregon water law, relatively junior water right holders may be forced to curtail irrigation to ensure the availability of water for more senior water right holders. These conflicts between water rights can involve instream or other surface irrigation water rights. For the Reference Case scenario, our model results suggest a surprising decline in the number of shutoffs in future decades. This is occurring in the model because climate change gives rise to warmer spring temperatures which begin to encourage earlier planting dates; with earlier planting comes an earlier start (and end) to irrigation. For some crops in future decades, and in particular locations, this will mean that some farmers will have completed their irrigation by the time that they would have (previously) been shut off (Figs. 5 and 6). The model suggests a reduction of 10-30%.

Figure 5. Seasonal distribution of irrgation requests for the Reference Case scenario.

Figure 6. Projected changes in irrigation shutoffs - Reference Case and HighClim scenarios.
-
For a range of alternative scenarios, the impact of varied assumptions about external factors (high population growth, high climate change, low climate change), and changes in assumptions related to sensitivity analysis (high irrigation, low irrigation), and combinations of these modified assumptions (Worst Case and Extreme scenarios), produce changes in the level and trajectory of irrigation shutoffs. The High Climate Change (HighClim) scenario produces a similar reduction in irrigation shutoffs as for the Reference Case (Fig. 6). For the other scenarios, the relative levels of irrigation shutoffs are consistent with what would be expected under these alternative assumptions (e.g., higher levels of shutoffs for “high irrigation” and for “worst case” scenarios).
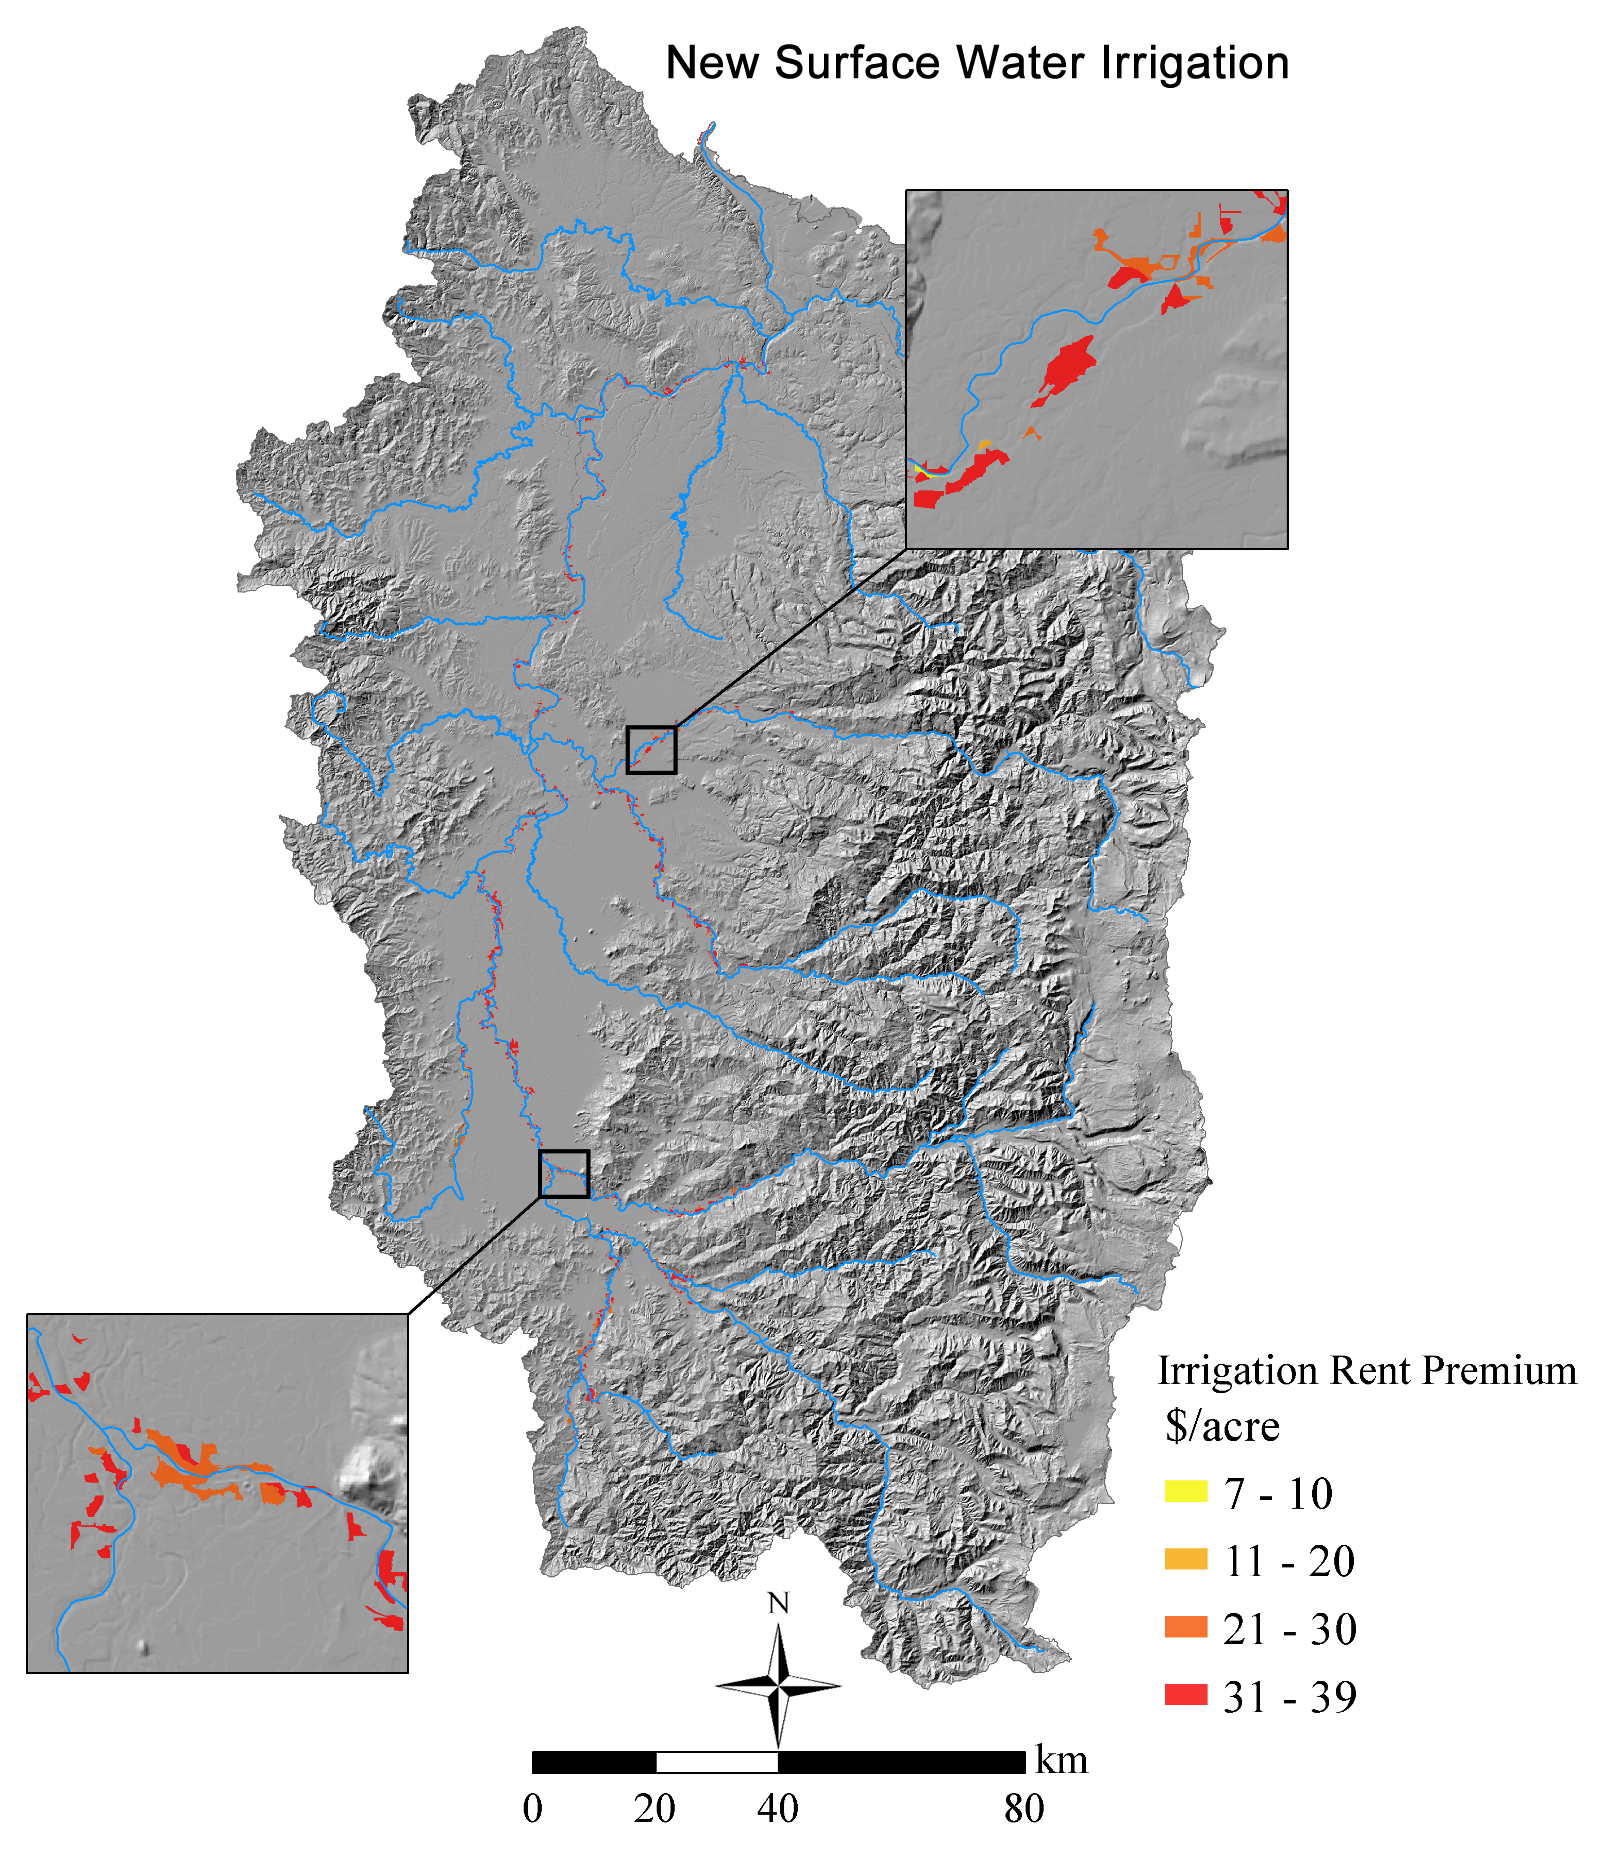
- When non-irrigated farmlands are given the option of acquiring new irrigation water rights tied to federal stored water contracts, some previously non-irrigated parcels acquire new water rights in our model. However, because of (1) the high additional costs of conveyance to move water to a farmer’s field from one of the tributaries below a federal reservoirs, and (2) the relatively modest incremental profits or increased net revenue that would be expected from irrigation, the adoption of new irrigation from stored water rights is found to be profitable for only a small number of acres (less than 8,000). Even when making optimistic assumptions about the low costs of conveyance, less than 30,000 acres of land adopt new irrigation water rights (Fig. 7).

Figure 7. Location of new irrigation water rights, with low conveyance cost assumptions.
Notes, Related Links & Publications
-
Jaeger W.K, Plantinga A.J., Langpap C., Bigelow DP, Moore KM. 2017. Water, Economics, and Climate Change in the Willamette Basin, Oregon. OSU Extension Service Publication EM 9157. https://catalog.extension.oregonstate.edu/em9157
-
W. Jaeger, Amos, A., Bigelow, D. P., Chang, H., Conklin, D. R., Haggerty, R., Langpap, C., Moore, K., Mote, P. W., Nolin, A. W., Plantinga, A. J., Schwartz, C. L., Tullos, D., and Turner, D. P., “Finding water scarcity amid abundance using human–natural system models”, Proceedings of the National Academy of Sciences, vol. 114, no. 45, pp. 11884 - 11889, 2017. https://www.pnas.org/content/114/45/11884
-
Kalinin, A. (2013). Right as Rain? The Value of Water in Willamette Valley Agriculture (MS Thesis). Oregon State University, Corvallis, Ore. http://hdl.handle.net/1957/42123
-
Jaeger, W. (2014, October 8). Modeling the Human Side of Water Scarcity in the Willamette Basin. WW2100 Recorded Webinar. https://media.oregonstate.edu/media/t/0_d5bbiufd
- Note: Our projections for both urban and agricultural water use are based on the set of behavioral economic models described here and elsewhere. These models reflect and are derived from economic theory; they are spatially and temporally explicit, and take into account many factors, including the following: water price, household income, population, population density, water delivery costs, land values and farm profits, land use change, crop choice, planting date, water availability across space and time, shifts in seasonality of crop growth due to climate change, daily determination of crop evapotranspiration, urban displacement of farmlands, and utilization rates for irrigation water rights. The 2015 Statewide Long-Term Water Demand Forecast Report, prepared by the consulting firm MWH for Oregon’s Water Resources Department, also makes estimates of future water demand in Oregon. Their methodologies differs from ours in several ways. In the case of agriculture, the MWH report draws on USGS estimates (which in turn are based on USDA Census of Agriculture data) for irrigated acres by county and by crop. Irrigation water demand is then estimated based on Net Irrigation Water Requirements, which are then adjusted to reflect the effects of climate change. In the case of urban water demand forecasting, MWH relied on existing Water Management and Conservation Plans (WMCP) developed by various city governments, and these were then adjusted in proportion to estimated population growth. Changes in per capita demand were estimated by MWH from 50 of the most recent WMCPs from communities across Oregon.
Contributors to WW2100 Agricultural Land and Water Use Modeling
- William Jaeger, OSU Applied Economics (lead)
- Alexey Kalinin, OSU Applied Economics (completed MS 2013, now a PhD student at the University of Wisconsin)
- Dan Bigelow, OSU Applied Economics (completed PhD 2015)
- Kathleen Moore, OSU Geography (completed PhD 2015; now a post-doctoral researcher, OSU Applied Economics)
- Cynthia Schwartz, OSU Biological and Ecological Engineering
- David Conklin, Oregon Freshwater Simulations
References
Amos, A. (2008). Freshwater Conservation in the Context of Energy and Climate Policy: Assessing Progress and Identifying Challenges in Oregon and the Western United States. University of Denver Water Law Review 12(1).
Getches, David, Sandi Zellmer, and Adell Amos. (2015). Water Law in a Nutshell, 5th. Minneapolis, Minn: West Academic.
Jaeger et. al. (2016). Scarcity amid abundance: Water, climate change, and the policy role of regional system models. Manuscript in preparation.
Kalinin, A. (2013). Right as Rain? The Value of Water in Willamette Valley Agriculture (MS thesis). Oregon State University, Corvallis, Ore. http://hdl.handle.net/1957/42123
Mendelsohn, R., Nordhaus, W. D., & Shaw, D. (1994). The impact of global warming on agriculture: a Ricardian analysis. The American Economic Review, 753-771.
Web page author: W. Jaeger
Last updated: September 2016